Node Exporter を使った Linux ホストメトリクスの監視
Prometheus の Node Exporter は、ハードウェアおよびカーネル関連の広範なメトリクスを公開します。
このガイドでは、以下のことを行います。
localhostで Node Exporter を起動する- 実行中の Node Exporter からメトリクスをスクレイピングするように設定された Prometheus インスタンスを
localhostで起動する
注Prometheus Node Exporter は *nix システム用ですが、Windows 用には同様の目的を持つ Windows exporter があります。
Node Exporter のインストールと実行
Prometheus Node Exporter は、tarball 経由でインストールできる単一の静的バイナリです。Prometheus の ダウンロードページからダウンロードしたら、展開して実行してください。
# NOTE: Replace the URL with one from the above mentioned "downloads" page.
# <VERSION>, <OS>, and <ARCH> are placeholders.
wget https://github.com/prometheus/node_exporter/releases/download/v<VERSION>/node_exporter-<VERSION>.<OS>-<ARCH>.tar.gz
tar xvfz node_exporter-*.*-amd64.tar.gz
cd node_exporter-*.*-amd64
./node_exporter
以下のような出力が表示され、Node Exporter が実行され、ポート 9100 でメトリクスを公開していることを示します。
INFO[0000] Starting node_exporter (version=0.16.0, branch=HEAD, revision=d42bd70f4363dced6b77d8fc311ea57b63387e4f)  source="node_exporter.go:82"
INFO[0000] Build context (go=go1.9.6, user=root@a67a9bc13a69, date=20180515-15:53:28)  source="node_exporter.go:83"
INFO[0000] Enabled collectors:                           source="node_exporter.go:90"
INFO[0000]  - boottime                                   source="node_exporter.go:97"
...
INFO[0000] Listening on :9100                            source="node_exporter.go:111"
Node Exporter メトリクス
Node Exporter がインストールされ実行されたら、/metrics エンドポイントに cURL することでメトリクスがエクスポートされていることを確認できます。
curl https://:9100/metrics以下のような出力が表示されるはずです。
# HELP go_gc_duration_seconds A summary of the GC invocation durations.
# TYPE go_gc_duration_seconds summary
go_gc_duration_seconds{quantile="0"} 3.8996e-05
go_gc_duration_seconds{quantile="0.25"} 4.5926e-05
go_gc_duration_seconds{quantile="0.5"} 5.846e-05
# etc.
成功!Node Exporter は現在、Prometheus がスクレイピングできるメトリクスを公開しており、出力のさらに下部には node_ で始まる広範なシステムメトリクスが含まれています。これらのメトリクス(ヘルプ情報とタイプ情報とともに)を表示するには
curl https://:9100/metrics | grep "node_"Prometheus インスタンスの設定
ローカルで実行されている Prometheus インスタンスは、Node Exporter メトリクスにアクセスするために正しく設定されている必要があります。以下の prometheus.yml の設定例は、Prometheus インスタンスに localhost:9100 を介して Node Exporter からスクレイピングすること、およびその頻度を指示します。
global:
  scrape_interval: 15s

scrape_configs:
- job_name: node
  static_configs:
  - targets: ['localhost:9100']
Prometheus をインストールするには、お使いのプラットフォーム用の最新リリースをダウンロードして展開してください。
wget https://github.com/prometheus/prometheus/releases/download/v*/prometheus-*.*-amd64.tar.gz
tar xvf prometheus-*.*-amd64.tar.gz
cd prometheus-*.*
Prometheus がインストールされたら、--config.file フラグを使用して、上記で作成した Prometheus 設定ファイルを指定して起動できます。
./prometheus --config.file=./prometheus.ymlPrometheus 式ブラウザによる Node Exporter メトリクスの探索
Prometheus が実行中の Node Exporter インスタンスからメトリクスをスクレイピングするようになったら、Prometheus UI(式ブラウザ)を使用してこれらのメトリクスを探索できます。ブラウザで localhost:9090/graph にアクセスし、ページ上部のメイン式バーを使用して式を入力します。式バーは以下のようになります。
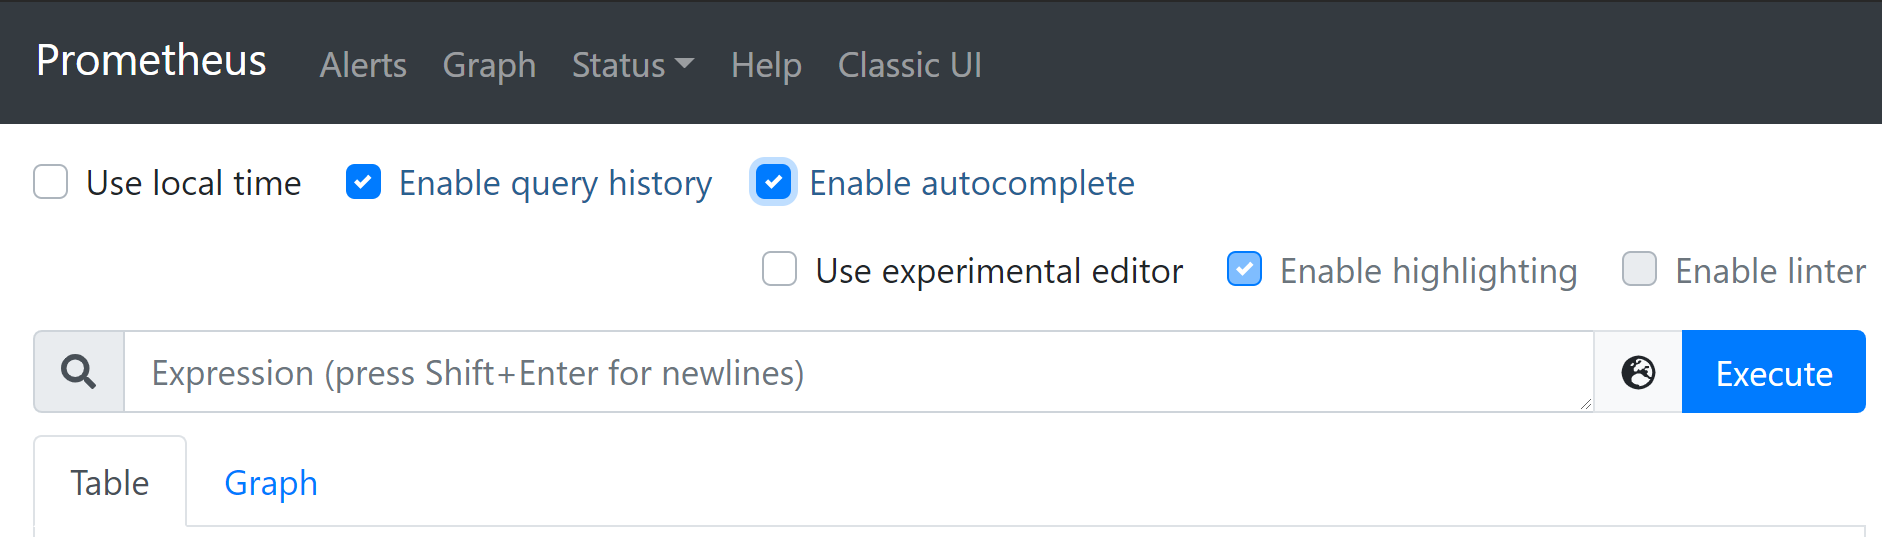
Node Exporter に固有のメトリクスは node_ で始まり、node_cpu_seconds_total や node_exporter_build_info のようなメトリクスが含まれます。
以下のリンクをクリックして、いくつかのメトリクス例を参照してください。
| メトリクス | 意味 |
|---|---|
rate(node_cpu_seconds_total{mode="system"}[1m]) | 過去 1 分間における、システムモードで費やされた CPU 時間の平均(秒単位) |
node_filesystem_avail_bytes | 非 root ユーザーが利用可能なファイルシステムスペース(バイト単位) |
rate(node_network_receive_bytes_total[1m]) | 過去 1 分間における、1 秒あたりの平均受信ネットワークトラフィック(バイト単位) |