Go で書かれたHTTPサーバーのインストルメンテーション
このチュートリアルでは、シンプルなGo HTTPサーバーを作成し、サーバーによって処理されたリクエストの総数を記録するためのカウンターメトリックを追加してインストルメントします。
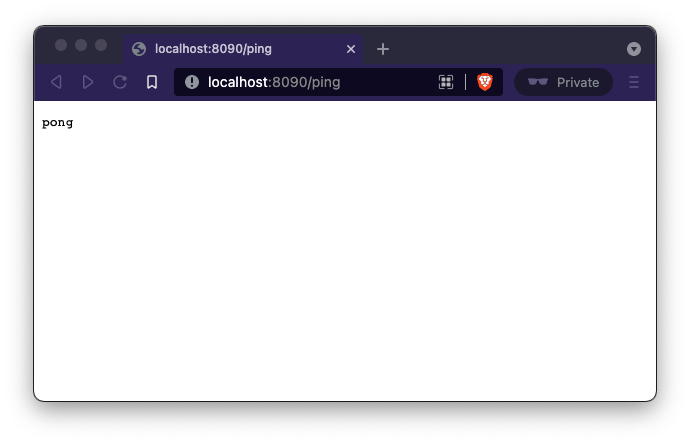
ここでは、/pingエンドポイントがあり、レスポンスとしてpongを返すシンプルなHTTPサーバーがあります。
package main

import (
   "fmt"
   "net/http"
)

func ping(w http.ResponseWriter, req *http.Request){
   fmt.Fprintf(w,"pong")
}

func main() {
   http.HandleFunc("/ping",ping)

   http.ListenAndServe(":8090", nil)
}
サーバーをコンパイルして実行する
go build server.go
./server次に、ブラウザでhttps://:8090/pingを開くとpongが表示されるはずです。
次に、pingエンドポイントへのリクエスト数をインストルメントするメトリックをサーバーに追加します。カウンターメトリックタイプは、リクエスト数が減らず、増加するだけなので、この目的に適しています。
Prometheusカウンターの作成
var pingCounter = prometheus.NewCounter(
   prometheus.CounterOpts{
       Name: "ping_request_count",
       Help: "No of request handled by Ping handler",
   },
)次に、pingCounter.Inc()を使用してカウンターのカウントを増やすようにpingハンドラーを更新します。
func ping(w http.ResponseWriter, req *http.Request) {
   pingCounter.Inc()
   fmt.Fprintf(w, "pong")
}
次に、カウンターをDefault Registerに登録し、メトリックを公開します。
func main() {
   prometheus.MustRegister(pingCounter)
   http.HandleFunc("/ping", ping)
   http.Handle("/metrics", promhttp.Handler())
   http.ListenAndServe(":8090", nil)
}prometheus.MustRegister関数は、pingCounterをDefault Registerに登録します。メトリックを公開するために、Go Prometheusクライアントライブラリはpromhttpパッケージを提供します。promhttp.Handler()は、Default Registerに登録されたメトリックを公開するhttp.Handlerを提供します。
サンプルコードは
package main

import (
   "fmt"
   "net/http"

   "github.com/prometheus/client_golang/prometheus"
   "github.com/prometheus/client_golang/prometheus/promhttp"
)

var pingCounter = prometheus.NewCounter(
   prometheus.CounterOpts{
       Name: "ping_request_count",
       Help: "No of request handled by Ping handler",
   },
)

func ping(w http.ResponseWriter, req *http.Request) {
   pingCounter.Inc()
   fmt.Fprintf(w, "pong")
}

func main() {
   prometheus.MustRegister(pingCounter)

   http.HandleFunc("/ping", ping)
   http.Handle("/metrics", promhttp.Handler())
   http.ListenAndServe(":8090", nil)
}
例を実行する
go mod init prom_example
go mod tidy
go run server.go
localhost:8090/pingエンドポイントを数回ヒットし、localhost:8090にリクエストを送信すると、メトリックが提供されます。
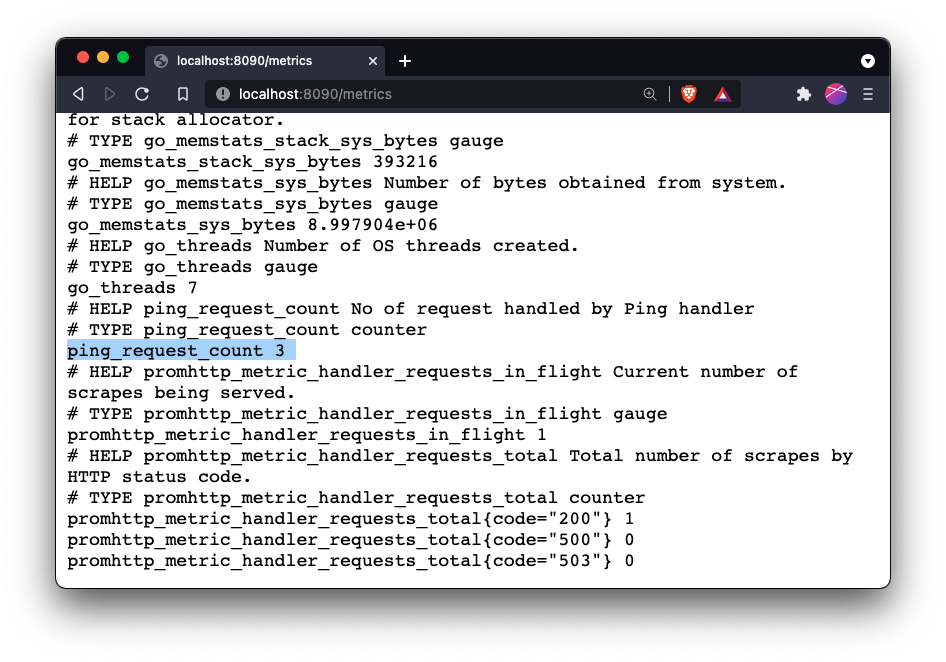
ここで、ping_request_countは/pingエンドポイントが3回呼び出されたことを示しています。
Default Registerには、Goランタイムメトリックのコレクターが付属しているため、go_threads、go_goroutinesなどの他のメトリックも表示されます。
最初のメトリックエクスポーターが構築されました。Prometheusの設定を更新して、サーバーからメトリックをスクレイプしましょう。
global:
  scrape_interval: 15s

scrape_configs:
  - job_name: prometheus
    static_configs:
      - targets: ["localhost:9090"]
  - job_name: simple_server
    static_configs:
      - targets: ["localhost:8090"]
prometheus --config.file=prometheus.yml